At our school, we often generate survey results that we consequently want to break down in different ways.
For example, we might want to see some of the responses in terms of grade-level of the student responding, or we might want to break down one answer in terms of another.
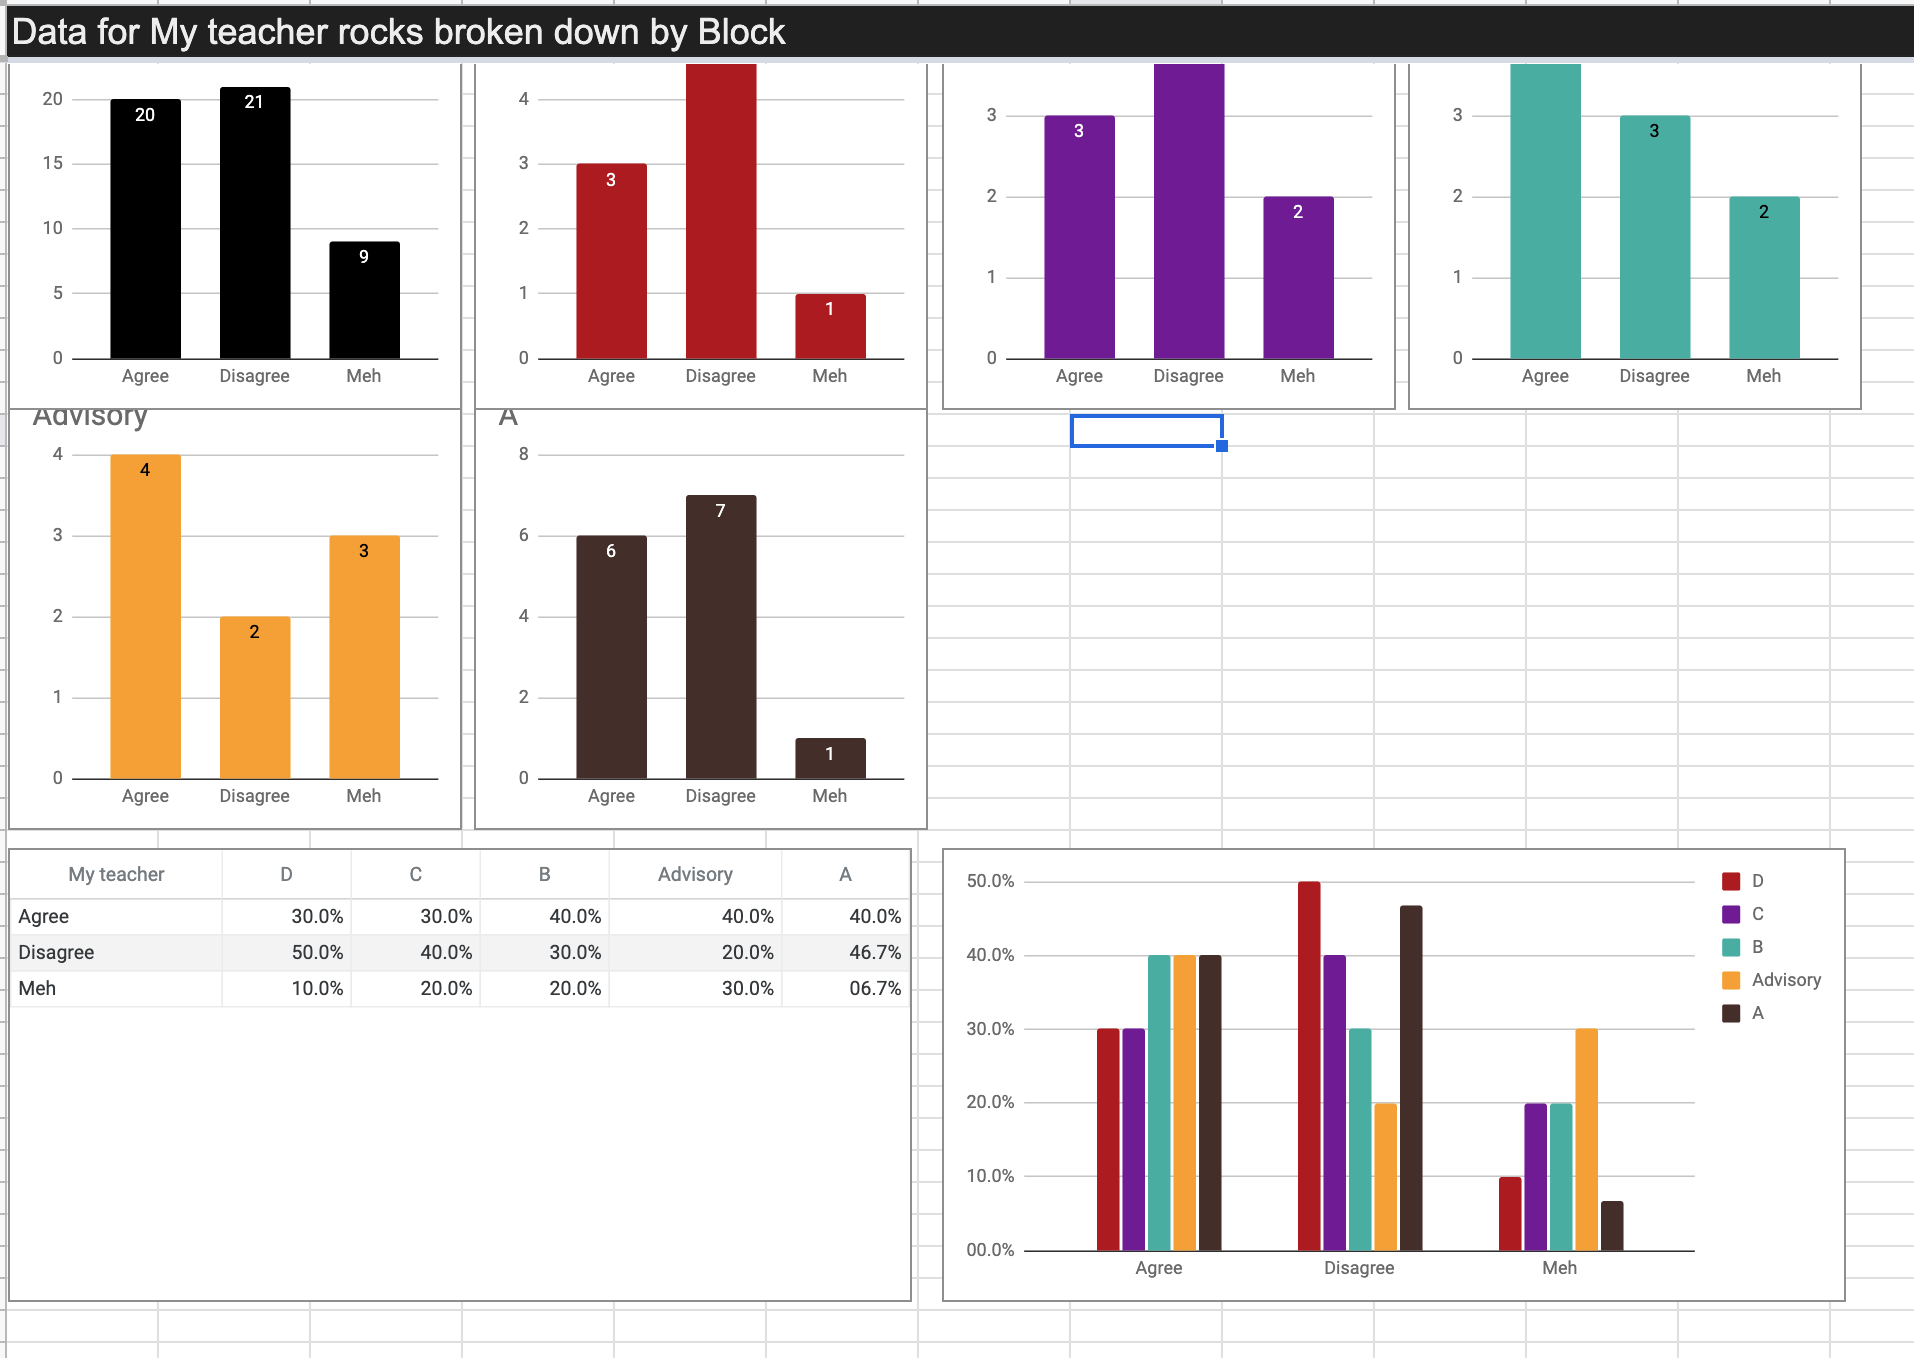
This tool lets you choose a column of data you want to analyze and a column of data you want to use for categories and then automatically creates histograms showing you the breakdown of responses per category.
Imagine you give a course survey per teacher in the school, for example, and that in that survey you ask what class students are in, what grade they're in, etc.
If you then want to see a graph of student responses broken down by grade-level of student or by course, you can do so using this tool.
Note: this is a very simple google sheets add-on with a bare-bones interface (you literally type in the column numbers of the data you want to break down in a comma separated list in a little text box that pops up. Nothing fancy here!).